
Anyone who has ever deployed their web application to production has already ran into the problem of how to monitor the health of that application. Is it online? Is it running? How fast is it performing? Are there any errors I need to be aware of? Which version is deployed? Sounds familiar?
In this post, I wanted to take a look into answering a couple of those questions. For one, to understand which version we have, we are going to build a Diagnostics Ping tool that will tell us if our application is online and which version is deployed, and we will use Heroku to build a simple tool to check if our app is online. We will also look at some other tools, briefly, that can help us do the monitoring.
The Ping Middleware
When you are building your application, you are obviously setting the version for it, right? If not, you can read this blog post to see how our team does it. So, we have an AssemblyVersion that is really important to understanding the application that is deployed.
In my "toolbelt", I have an OWIN middleware that I use frequently. This middleware has the function of acting as a ping responder (this comes in handy when using something like the Traffic Manager), but during each request, it also responds with the version read from the AssemblyInfo file.
This is the gist of it:
public virtual ActionResult Status()
{
    var sb = new StringBuilder("<tt>");


    sb.AppendLine(Request.QueryString.ToString());


    var assembly = System.Reflection.Assembly.GetExecutingAssembly();
    var fvi = System.Diagnostics.FileVersionInfo.GetVersionInfo(assembly.Location);
    var version = fvi.FileVersion;
    var creationDatetime = System.IO.File.GetCreationTime(assembly.Location);


    sb.AppendFormat("\r\nApplication version: {0}\r\n", version);
    sb.AppendFormat("\r\nBuilt on (UTC): {0}\r\n", creationDatetime.ToUniversalTime().ToString("R"));
    sb.Append("</tt>");
    return Content(sb.ToString());
}
The Pinger
Next up, you need a service that will constantly monitor your site (your /status page, if you will), and notify you if it ever goes offline. There are a couple free services out there, like Pingdom (it also has a paid plan, btw), and if you have a mission critical software, you really need to use something like that. The free plan checks every 15 minutes, while the pro plans can do that per minute.
As a challenge, I wanted to do something a little bit different, and try to write something similar myself. I always liked Geckoboard dashboards. Among other things, they also have a widget that enables monitoring the status of an application; but it requires an "endpoint" capable of talking to Geckoboard. So, I built one, using Ruby and Heroku. At the time of doing that, Heroku's cheapest instance was actually free - they now have a limitiation that it has to sleep at least 6 hours in a 24 hour period. But that can be easily managed.
require 'sinatra'
require 'json'
require 'net/http'
require 'uri'
require 'benchmark'
require 'nexmo'
require 'oneapi-ruby'


get '/' do
  "Nothing here"
end


get '/status/:server' do


available = false
servers = Hash["Beta", "https://the-beta-deploy.notHere"]
val = servers[params[:server]]


if val != nil then
#available = true


uri = URI.parse(val)
http = Net::HTTP.new(uri.host, uri.port)
http.use_ssl = true
http.verify_mode = OpenSSL::SSL::VERIFY_NONE


request = Net::HTTP::Get.new(uri.request_uri + "/system/status")


response = http.request(request)


if response.code == "200"
 	available = true
time = Benchmark.measure do
http.request(Net::HTTP::Get.new(uri.request_uri))
# measures the response time
 	end
 else
 	available = false
 end
end


content_type :json
status = { :status => "Down" }
if available then
status[:status] = "Up"
status[:responseTime] = "#{time.real} s"
end


status.to_json
end
I have never used or written Ruby before, so if someone can do this better, I'd love to see how :-).
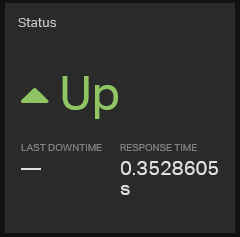
Next up, in Geckoboard, you can add a Custom widget (Monitoring) to get a nice display of your application's status.
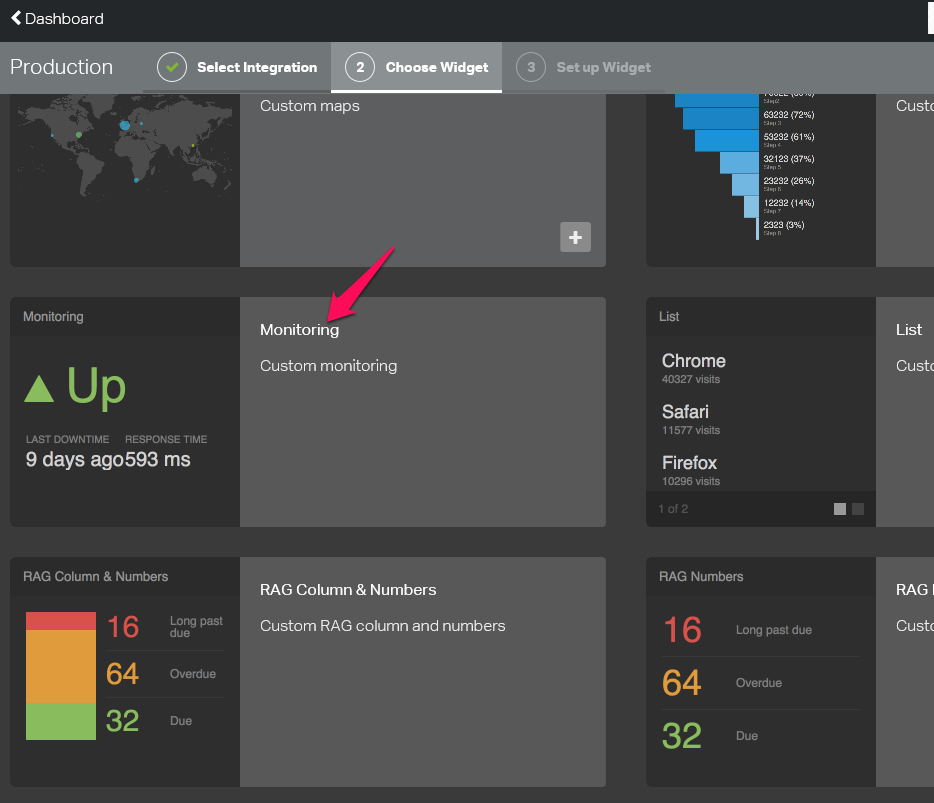
In your dashboard, you'll then see this nice looking widget:
Application Insights / New Relic
Of course, when the application is a bit more serious, you'll need a bit more power to make sure it's running well. That's where 3rd party tools like New Relic come into play. But, recently, Microsoft started entering into this market of application performance monitoring, with its latest offering - Application Insights. It's hosted on Azure, and it is pretty awesome. You have a free tier available, that holds your raw data for about 7 days, and it supports around 5 million data points per month. That's good enough, if you're careful about what you are sending on to the service.
The good part is, the availability monitoring by Application Insights is a lot better than the above Ruby script. It enables setting up custom tests to make sure the application is not only up and running, but actually responding properly. You also have a simple ping test available.
Giving it a spin
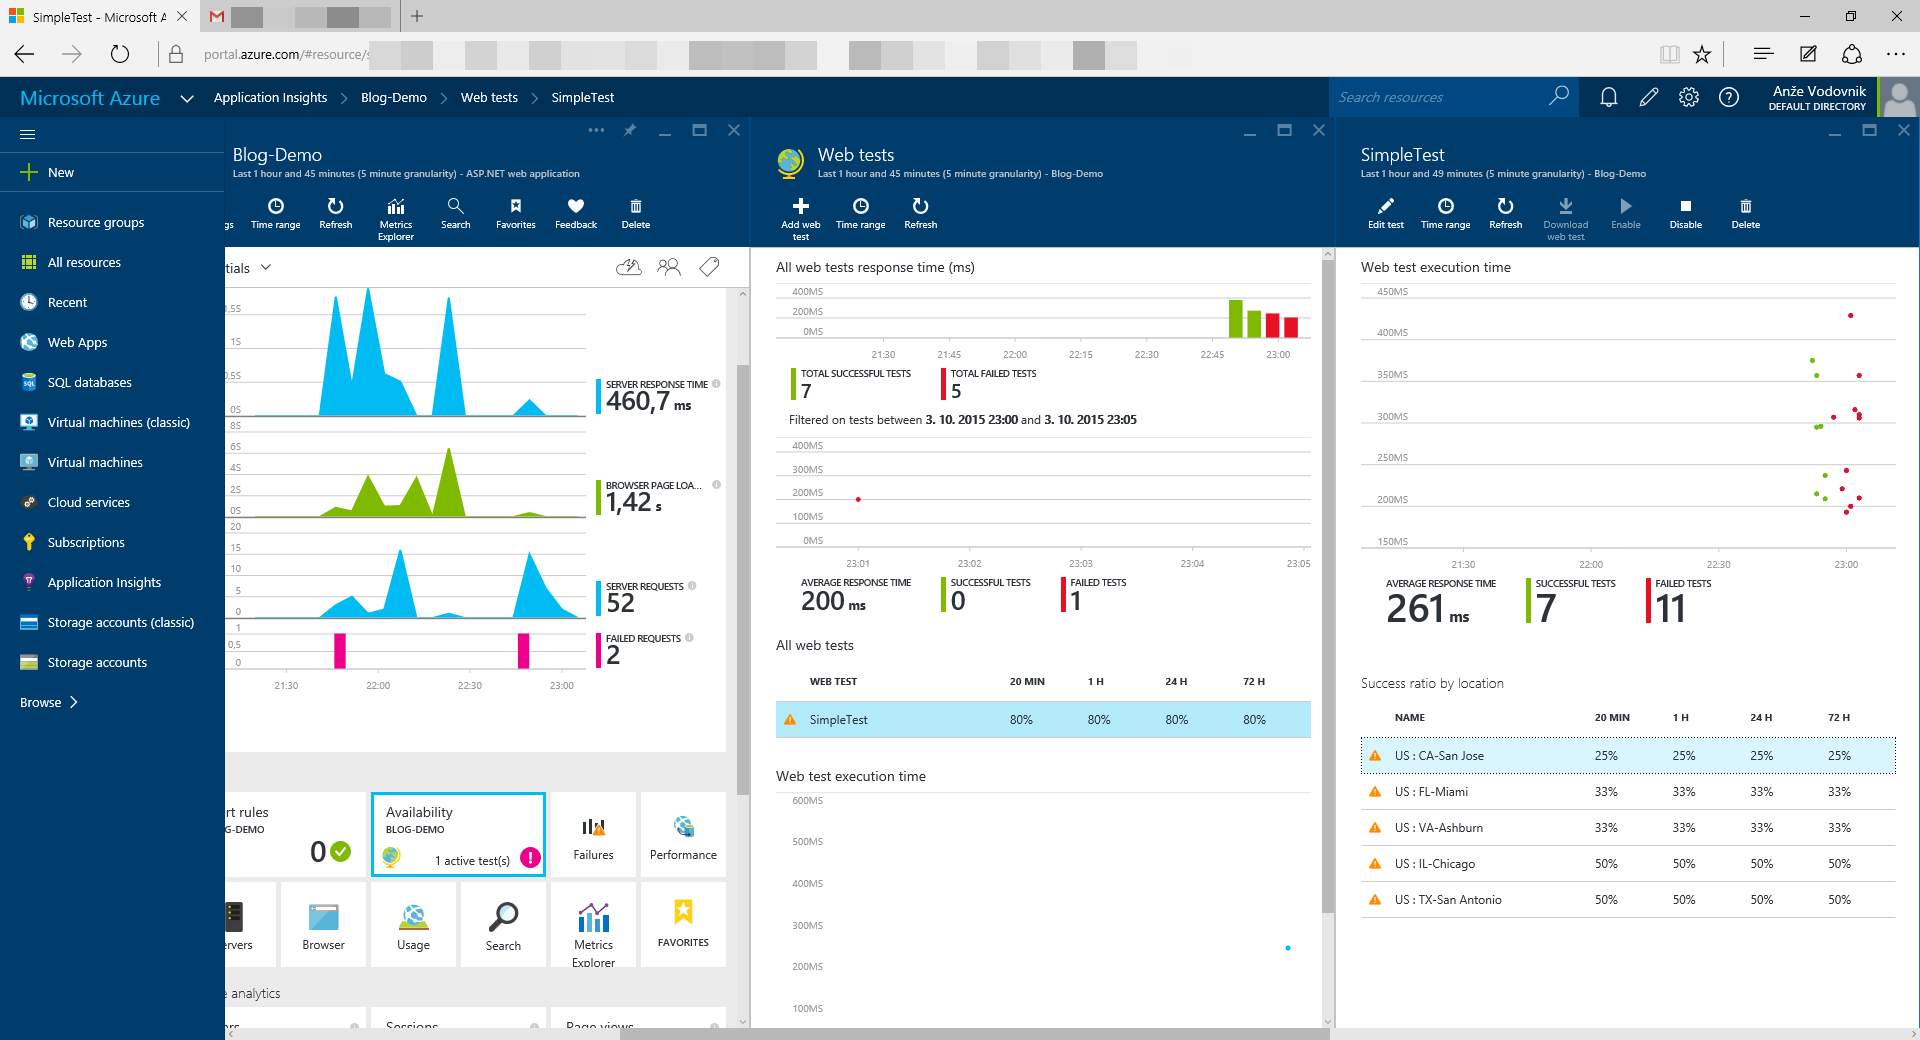
There are many blogs already covering Application Insights, and setting up monitoring for cloud applications (e.g. by using New Relic) and I didn't want to duplicate content. However, I did want to test it out and see how it performs. So, I wrote a sample application, which is published on this GitHub repository, and I deployed it to an Azure Web App. In the next step I went ahead and configured a Web Test (under the Availability tile).
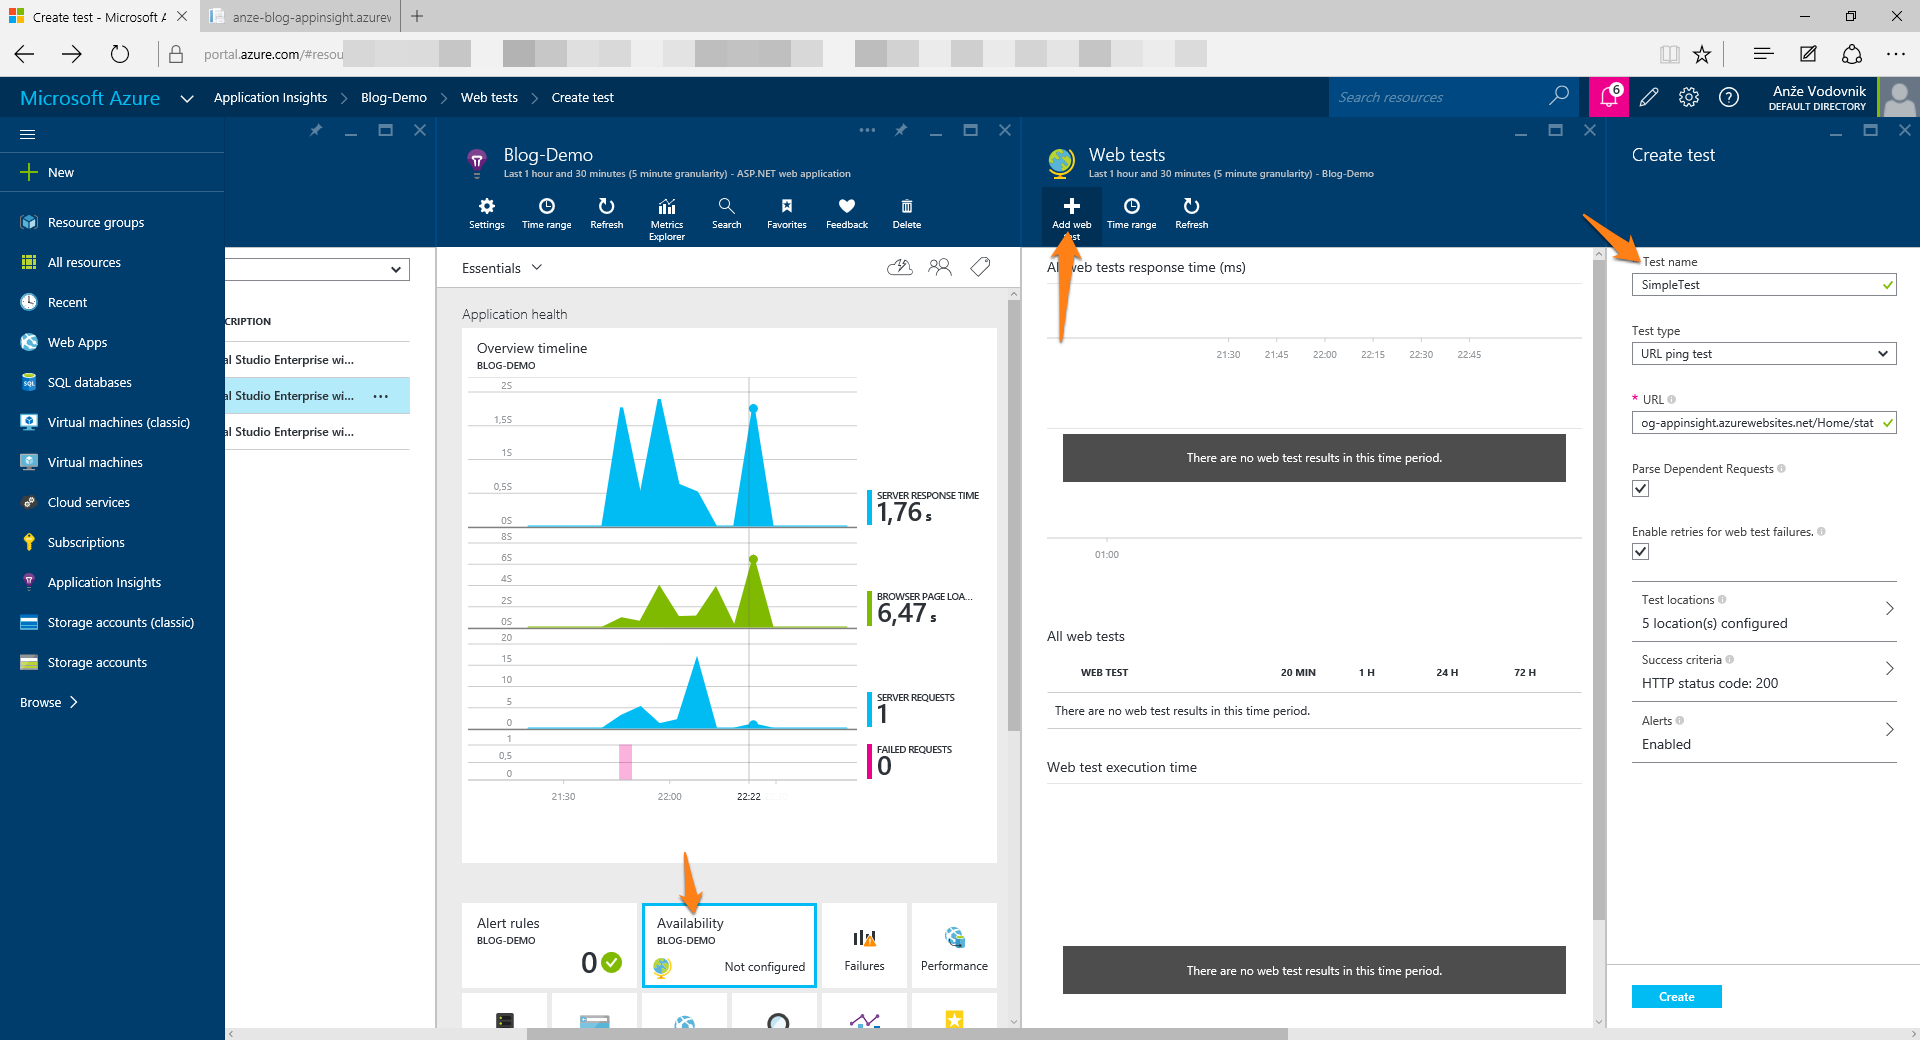
Then, after a couple minutes, I started seeing results of the web test that was happening. In my case, obviously, I set up a very simple test that simply checks a /status page and verifies a 200 status code is returned. I then turned off the app.
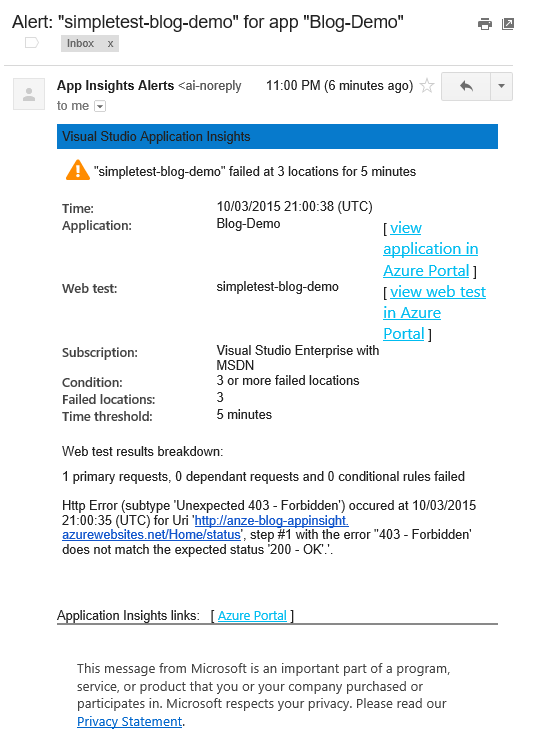
And also, because by default, alerts are enabled on the Web Tests, I received an email in my inbox.
Conclusion
All in all, every modern application needs some monitoring. You need to be able to know if your application is running, and ideally how it's running. Ideally, you also need a way to know what your users are doing. I'll touch on that in a later blog post. Anyway, for monitoring, you can either use a simple version like the Ruby script above, or you can go full-in, with a solution like New Relic, or something simpler (at the moment) like Application Insights, but you need to have something. Hopefully, this post gives you a push in the right direction.